Available now · full-time, part-time, remote & permanent roles in the Netherlands
Gabriel Nnana
Data Analyst · Business Intelligence · Healthcare Analytics
I turn messy healthcare and business data into decisions people act on.
5+ years across healthcare and business operations, a clinical biochemistry background, and an MBA in Data Analytics & AI in progress at Wittenborg University of Applied Sciences.
lower average patient waiting time after a clinic adopted my ED staffing recommendations
1,981
data inconsistencies corrected across 12,000+ healthcare operational records
16 → 5 h
weekly performance review prep, cut by Power BI dashboards I built
251
maternity records analysed with chi-square and z-tests in a CRISP-DM gestational diabetes study
Studied and worked at
London · MSc and Clinical Data Coordinator
Netherlands · MBA, Data Analytics & AI
What I do
From raw records to a decision you can defend.
Healthcare analytics
ED waiting time and staffing, bed occupancy, readmission risk and clinical research data, read by someone with a biomedical background.
BI & reporting
Power BI, DAX, Power Query and Excel dashboards that replace paper records and manual reports with live KPIs.
Data quality & prediction
Validation rules and cleaning that make the numbers reliable, then regression, machine learning and SHAP to show what drives them.
Selected work
Case studies
Each project follows CRISP-DM. It starts with the business question, goes through data quality, and ends with a recommendation someone can act on. Open any project for the full story.
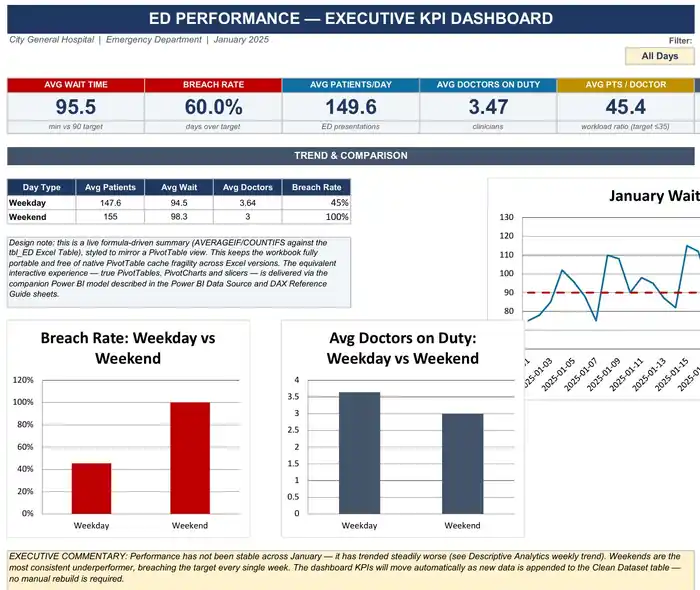
ED performance KPI dashboard: average wait 95.5 min. Weekends breached the 90-minute target on 100% of days vs 45% on weekdays.
Healthcare · Client work
Emergency department waiting time & staffing
~20%lower average waiting time after management adopted my staffing recommendations
Regression analysis at Carudo Clinic Center found a 118-minute peak wait and a 25% emergency case threshold driving delays. Weekends ran on 3 doctors against 3.6 on weekdays.
Power BIExcelRegressionCRISP-DM
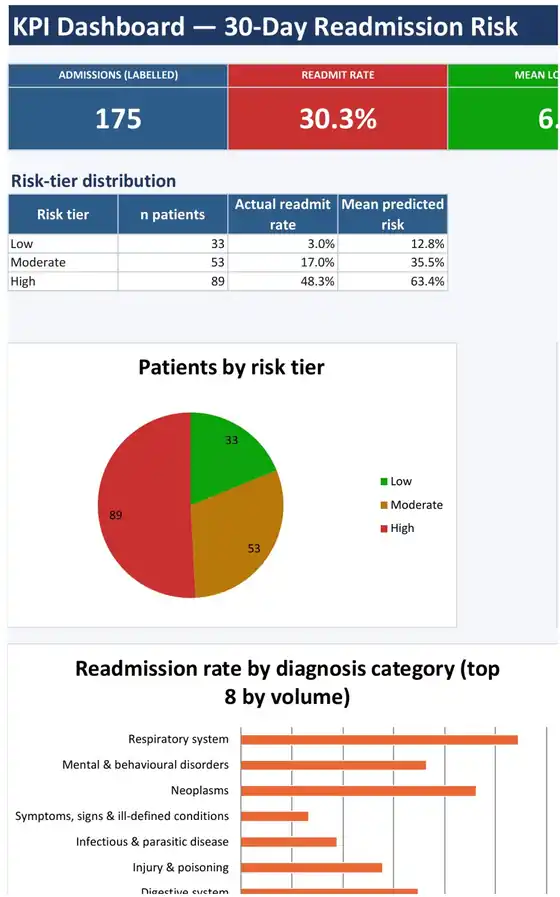
Risk-tiered KPI dashboard: 175 admissions, 30.3% readmission rate. Respiratory conditions led readmissions by diagnosis.
Healthcare · Predictive analytics
30-day hospital readmission risk
48% vs 3%actual readmission in the high-risk tier vs the low-risk tier
A full pipeline comparing Logistic Regression, Random Forest and XGBoost on ROC-AUC, PR-AUC, recall and calibration, with SHAP explaining each patient's score for discharge planning.
Pythonscikit-learnXGBoostSHAPPower BI
1-minute demo walkthrough. Interactive Power BI report: Administration had the largest share of leavers (37%). Laboratory Technicians had the most leavers by role (59).
HR · Business intelligence
HR attrition analytics
3×attrition among overtime workers (31.1% vs 10.2%), validated with chi-square tests
A 1,403 employee dataset modelled in Power Query with DAX KPIs. 43% of leavers exited within two years, which points retention work at early tenure onboarding and workload.
Power BIDAXPower QueryStatistics
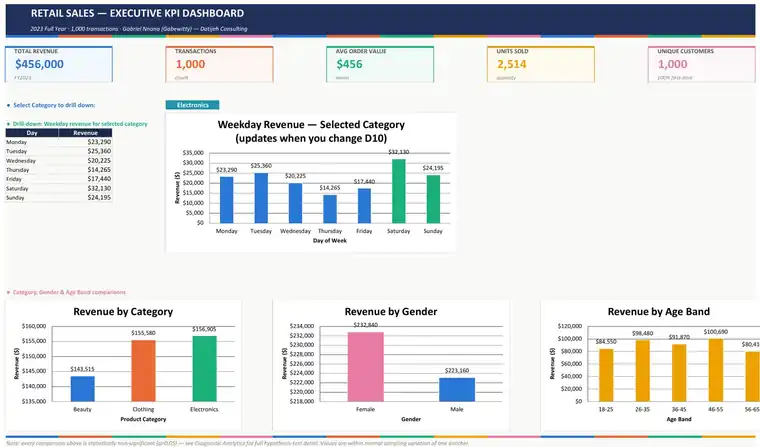
Executive KPI dashboard over 1,000 transactions: Electronics was the top category and Saturday the strongest trading day.
Retail · Analytics workbook
Retail sales KPI dashboard
$456Krevenue analysed from descriptive through to prescriptive
Hypothesis testing across gender, category, age and day type. I caught a data truncation error that would have shown a false declining revenue trend before it reached stakeholders.
ExcelHypothesis testingDAX & SQL guide
Founder & team lead · 2026
NestNL
Arrive · Settle · Thrive
When I arrived in the Netherlands for my MBA, everything a new international student needs to know was scattered across dozens of search results. So I built the thing I wished I'd had.
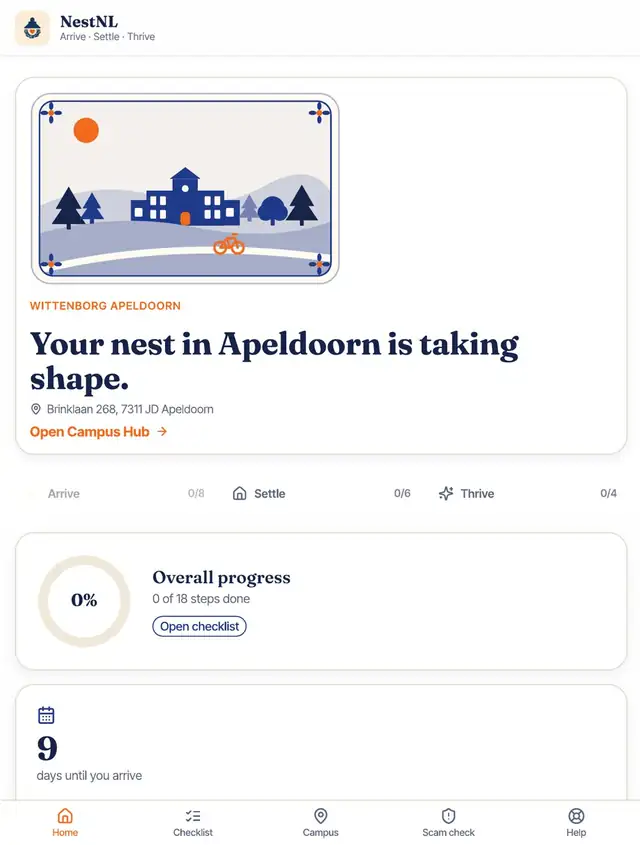
NestNL guides students through their first 30 days in 18 steps: municipality registration, BSN, the residence permit card, a bank account, housing and GP registration, plus a campus hub, Scam Shield and optional premium support.
Problem to product
Brought the business problem and built the web app myself
Led a team of 5
International students from Nigeria, Iran and India
Pitched to Wittenborg
Proposed as a university partnership, under review
With thanks to Dr Cansu Kadioglu, my Marketing Management lecturer at Wittenborg and one of the inspirations behind NestNL.
The live NestNL home screen
Testimonials
What people say about my work
You turned our healthcare data into actionable insights, helping us identify opportunities to improve patient waiting time and strengthen financial control.
Dr AnaikotCarudo Clinic Center
Bravo! You demonstrated strong research skills, with an analytical approach to investigating complex problems.
Prof ItaAkwa Ibom State University
I approach challenges logically, look for practical solutions, and focus on getting the job delivered on time.
JefferyDe Aftermath Consultancy Firm
Experience
Where I've done the work
Nov 2025 to present · Remote
Healthcare Data Analyst (Freelance)
Carudo Clinic Center, Uyo · Enlightir Global
Built Power BI and Excel dashboards for emergency department capacity planning, with a regression-based wait-time model, staffing rule analysis and scenario planning that replaced paper records. Staffing recommendations adopted by management cut average waiting time by ~20%. Cleaned and validated 12,000+ operational records, correcting 1,981 inconsistencies, and built Power BI dashboards that cut weekly review preparation from 16 to 5 hours. Led a CRISP-DM analysis of a gestational diabetes screening dataset.
Sep 2023 to Apr 2025
Healthcare Data Analyst & Clinical Data Coordinator
University of Westminster · London
Analysed laboratory and clinical datasets with SQL, Excel, Power BI and Python, including 374+ records for a potassium ion and atrial fibrillation research study. Built dashboards for clinical trends, ran ETL and validation checks, and supported 11+ master’s and 2 PhD students with statistical analysis.
Sep 2022 to Nov 2024
Data Quality Analyst
De Aftermath Consultancy Firm
Cleaned and validated data across 25+ client projects, catching duplicate records, gaps and inconsistencies. Designed standard validation rules and cleaning processes that reduced manual checking and correction by ~25%.
Dec 2017 to present
Founder
Datijeh Nigeria Limited
Founded and lead a workforce, recruitment and operations consultancy (30+ client projects a year, team of 34). Manage an annual budget of ~$450K, calculate IRR and EVA for investment decisions, and moved reporting from paper to digital across 11+ locations, including a weekly P&L for each location.